The world of finance and investing is built upon multiple analytical frameworks, each offering distinct insights into market behavior. Among these, fundamental analysis examines a company’s core financial health, while technical analysis focuses on price action and market sentiment. Understanding how they differ—and when to apply each—can transform decision-making, enhance risk management, and ultimately improve portfolio performance.
In this comprehensive guide, we’ll delve into the definitions, methodologies, strengths, weaknesses, and practical applications of both analytical approaches. By the end, you’ll be equipped to choose the right tool—or combine them effectively—to navigate today’s complex financial markets.
Definitions and Core Principles
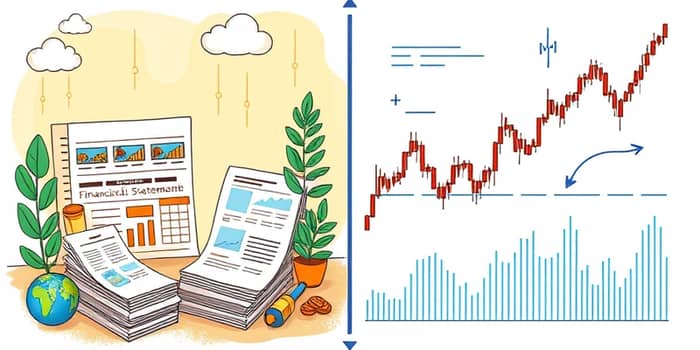
Fundamental analysis assesses an asset’s intrinsic value by evaluating quantitative data like financial statements and qualitative factors such as management reputation. It seeks to determine whether a security is undervalued or overvalued relative to its true worth. Key inputs include income statements, balance sheets, cash flow statements, sector dynamics, and macroeconomic indicators like GDP growth and interest rates.
In contrast, technical analysis relies solely on historical price and volume patterns. It operates on the premise that all known information is already baked into market prices, and that history tends to repeat itself. Traders use chart patterns (head and shoulders, triangles), momentum indicators (RSI, MACD), and support/resistance levels to identify potential entry and exit points over shorter time frames.
Key Comparative Topics
A direct comparison highlights the fundamental differences in purpose, data sources, and typical users.
Methodologies Explained
Both approaches deploy specialized tools and statistical techniques tailored to their objectives.
Fundamental analysts may construct discounted cash flow models, calculate valuation ratios, and benchmark a company against its peers. They often review earnings reports, dividend history, and balance sheet strength to form a holistic view of financial health.
- P/E ratio, P/B ratio, ROE, and debt/equity analysis
- Discounted Cash Flow (DCF) and Dividend Discount Models (DDM)
- Industry trend studies and management quality assessment
Technical analysts, on the other hand, interpret price charts using moving averages, Bollinger Bands, and oscillators like MACD or RSI. They identify chart patterns, monitor volume spikes, and draw trendlines to anticipate price pivots.
- Simple and exponential moving averages
- Bollinger Bands and Fibonacci retracements
- Candlestick patterns such as doji, hammer, and engulfing
Strengths and Weaknesses
Each analysis brings unique advantages but also carries limitations.
- Fundamental analysis offers deep insight into long-term viability but may miss short-term market swings and can misjudge timing in irrational markets.
- Technical analysis excels at timing trades and spotting momentum shifts but may generate false signals during low-volume or erratic price action.
- Many investors find that combining both approaches helps balance perspective and improve overall results.
Practical Applications and Real-World Implications
Choosing the optimal approach depends on your investment horizon, risk tolerance, and end goals. Long-term, buy-and-hold investors often rely on fundamental research to select stocks with solid growth prospects and resilient business models. In contrast, traders seeking quick profits focus on technical setups and strict risk controls.
Institutional investors and wealth managers frequently adopt a hybrid model: using fundamentals for stock selection and technical signals for precise timing. This integrated strategy can enhance returns while managing downside risk in volatile markets.
Integrating Analysis Approaches
An effective investment strategy rarely hinges on a single tool. By understanding the strengths of each method, you can create a complementary framework:
1. Conduct a fundamental screen to identify undervalued securities with robust financials.
2. Apply technical analysis to refine entry and exit points, using indicators to confirm momentum and manage risk.
3. Monitor macroeconomic trends and earnings calendars to adapt positions in response to evolving conditions.
Combining long-term value assessment with short-term price signals allows investors to capture opportunities across market cycles, blending deep research with agile execution.
Conclusion
Fundamental and technical analysis each play vital roles in modern finance. While fundamentals reveal the intrinsic worth of assets over the long haul, technicals illuminate the ebb and flow of market sentiment and timing. Mastery of both disciplines—and knowing when to deploy them—can empower you to make informed, balanced investment decisions that stand up to market turbulence and deliver sustainable performance over time.
References
- https://www.investopedia.com/ask/answers/difference-between-fundamental-and-technical-analysis/
- https://www.indeed.com/career-advice/career-development/fundamental-vs-technical-analysis
- https://www.investmentbankingcouncil.org/blog/how-does-fundamental-analysis-differ-from-technical-analysis
- https://info.nyif.com/technical-analysis-vs-fundamental-analysis/
- https://thetradinganalyst.com/fundamental-vs-technical-analysis/
- https://www.investopedia.com/terms/f/fundamentalanalysis.asp
- https://www.ebsco.com/research-starters/business-and-management/fundamental-vs-technical-financial-analysisfundamental